Demographic Information
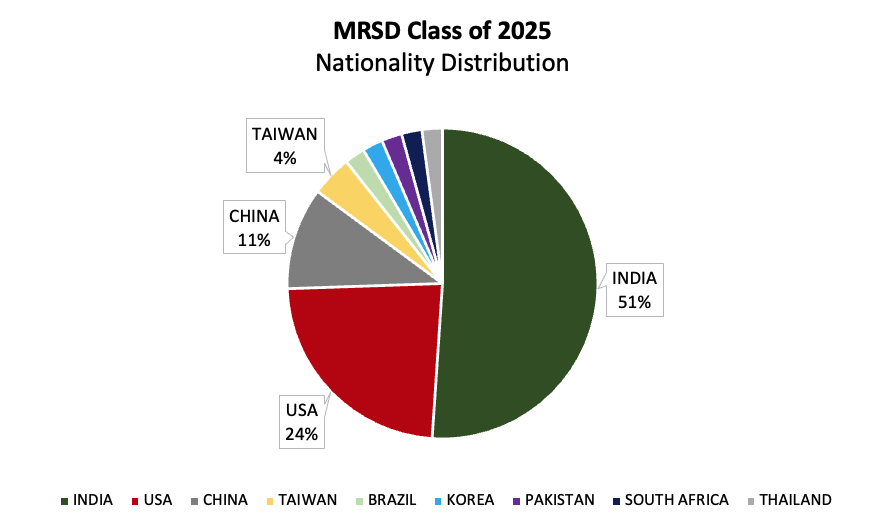
| Number | Gender M/F | |
| Applied | 209 | 184/25 |
| Enrolled | 47 | 38/9 |
 |
||
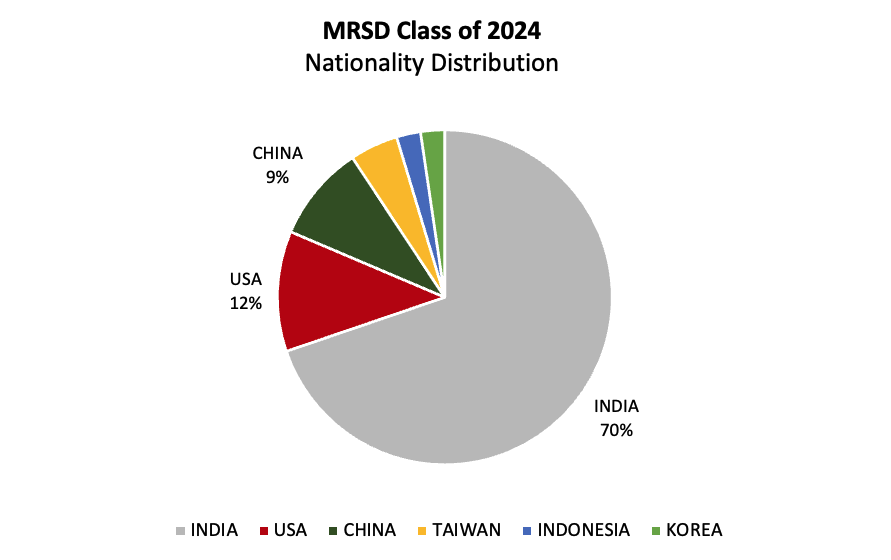
| Number | Gender M/F | |
| Applied | 333 | 289/43 |
| Enrolled | 43 | 34/9 |
 |
||
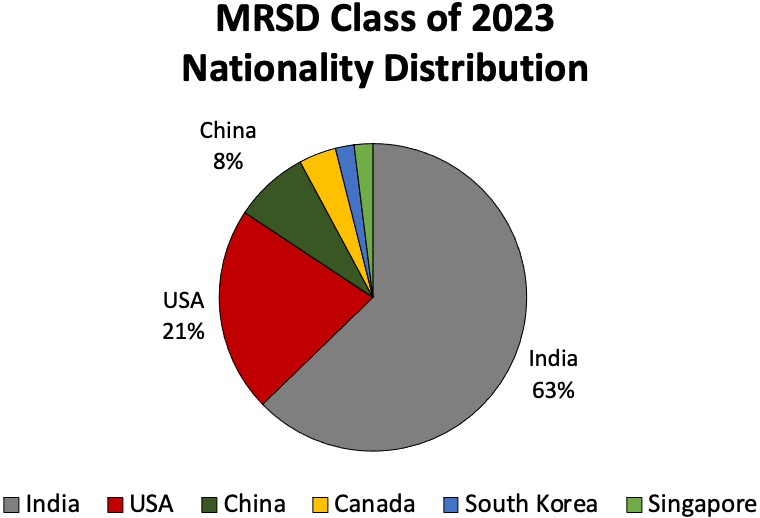
| Number | Gender M/F | |
| Applied | 348 | 300/48 |
| Enrolled | 50 | 35/15 |
 |
||
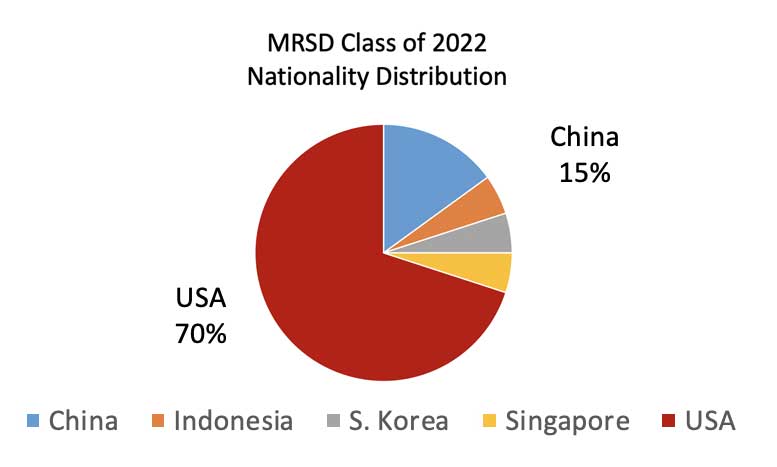
| Number | Gender M/F | |
| Applied | 401 | 330/71 |
| Enrolled | 20 | 16/4 |
 |
||
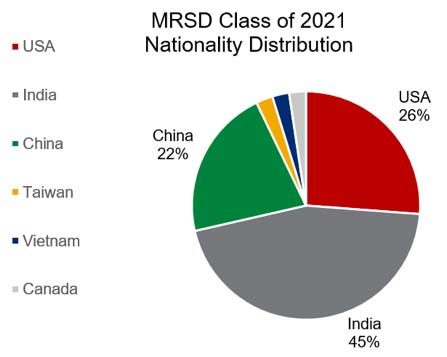
| Number | Gender M/F | |
| Applied | 415 | 357/58 |
| Enrolled | 46 | 34/12 |
 |
||
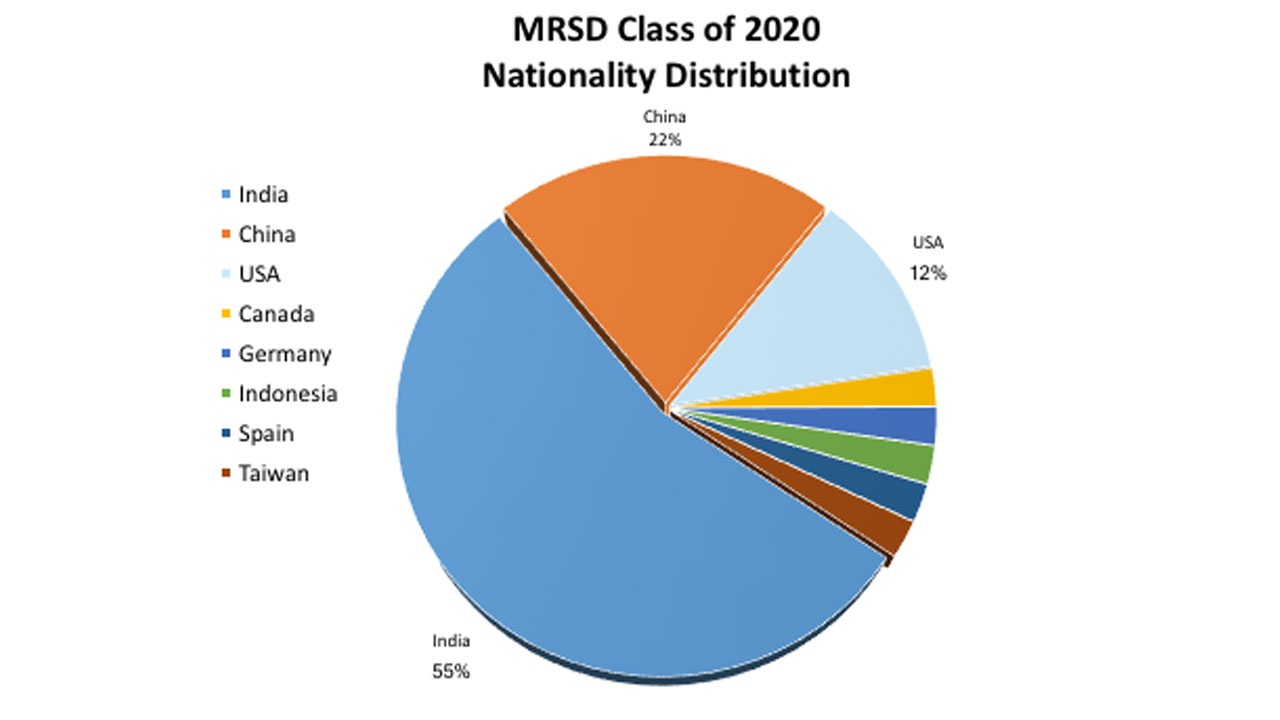
| Number | Gender M/F | |
| Applied | 382 | 336/46 |
| Enrolled | 42 | 37/5 |
 |
||
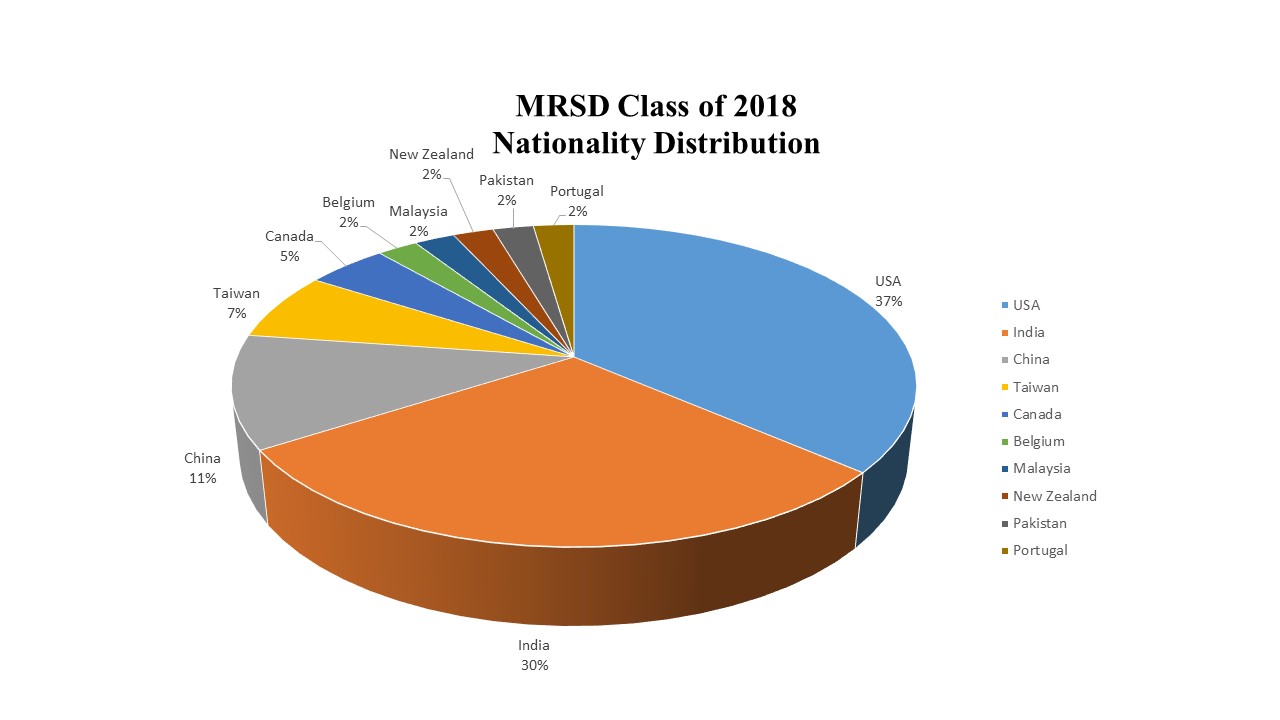
| Number | Gender M/F | |
| Applied | 310 | 271/39 |
| Enrolled | 44 | 36/8 |
 |
||
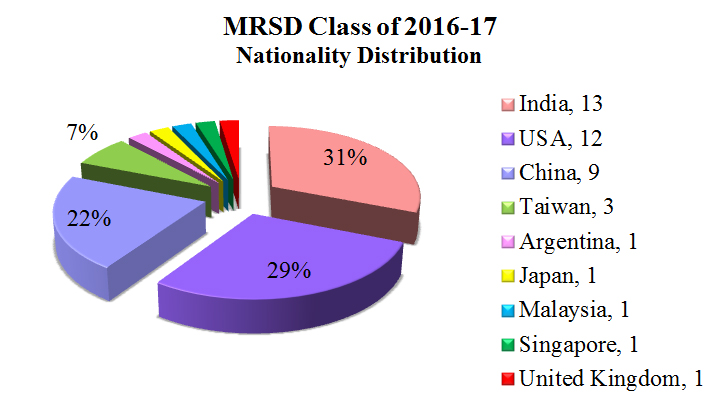
| Number | Gender M/F | |
| Applied | 234 | 196/38 |
| Enrolled | 42 | 36/6 |
 |
||
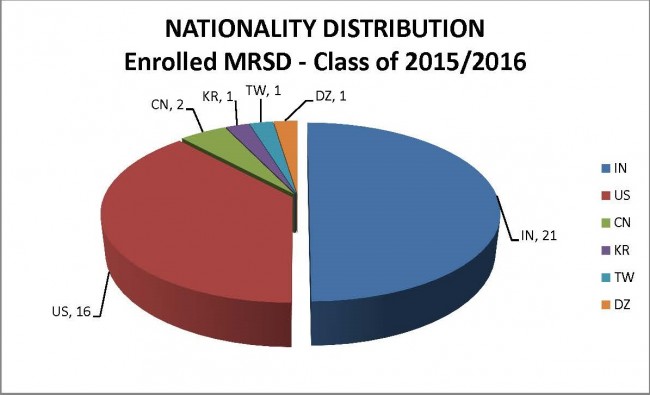
| Number | Gender M / F | |
| Applied | 168 | 152 / 16 |
| Enrolled | 42 | 32 / 10 |
 |
||
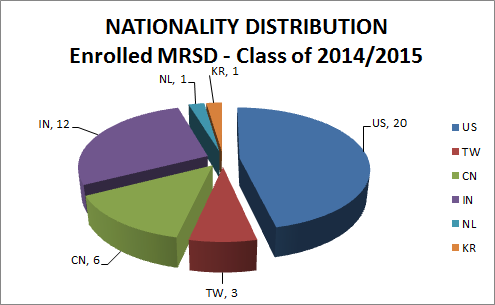
| Number | Gender M / F | |
| Applied | 141 | 115 / 26 |
| Enrolled | 43 | 36 / 7 |
 |
||
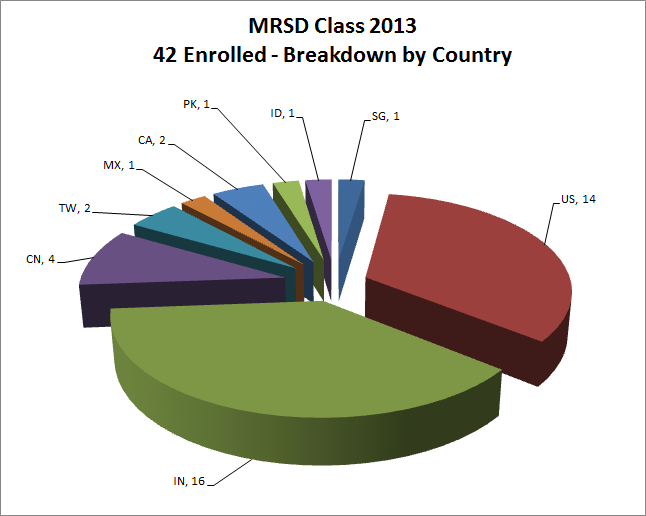
| Number | Gender M / F | |
| Applied | 119 | 101 / 18 |
| Enrolled | 42 | 34 / 8 |
 |
||
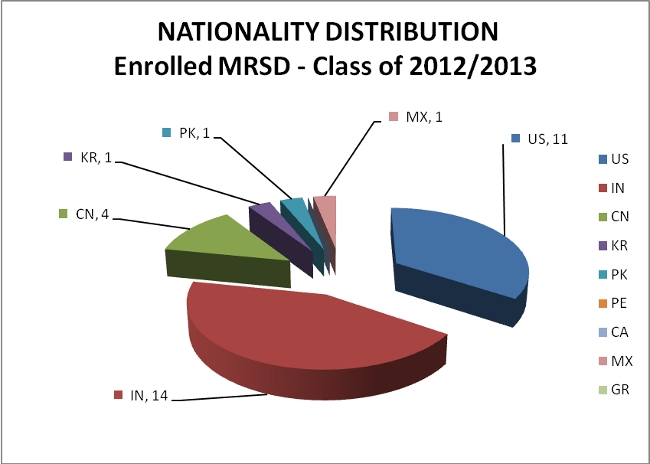
| Number | Gender M / F | |
| Applied | 73 | 60 / 13 |
| Enrolled | 32 | 28 / 4 |
 |
||
| Number | Gender M / F | |
| Applied | 47 | 46 / 1 |
| Enrolled | 19 | 19 / 0 |
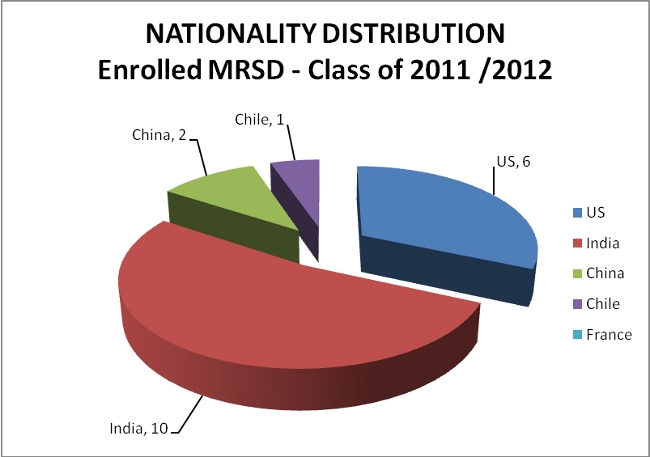 |
||

